Work-related fatal injuries in Great Britain 2026
This newsletter provides headline numbers on deaths resulting from work-related accidents in 2025/26 that were reportable under the Reporting of Injuries, Diseases and Dangerous Occurrences Regulations (RIDDOR). Numbers include both fatal injuries to workers and to members of the public.
Fatal injuries to workers by main industry 2025/26
126 workers killed across all industry. The construction and agriculture, forestry and fishing sectors continue to account for the greatest number of workers killed in fatal accidents each year, between them accounting for over a third of all of all of all fatal injuries to workers in 2025/26. Below fatal injuries to workers in 2025/26. Above-Fatal Injuries to workers in 2025/26
Fatal injuries to workers by gender and age (2025/26)
Fatal injuries to workers are predominately to males, largely reflecting a greater proportion of men working in higher risk jobs. In 2025/26, 117 (93%) of all worker fatalities were to male workers, a similar proportion to earlier years.
In terms of age, 32% of fatal injuries in 2025/26 were to workers aged 60 and over, even though such workers made up only 12% of the workforce.
Below left shows the fatal injury rate by age group for the period 2021/22-2025/26. This clearly shows how the rate of fatal injury increases with age, with workers aged 60-64 having a rate around twice the all ages rate and workers aged 65 and over a rate that is 4 times as high as the all ages rate.


Chart on the right shows rate of fatal injuries by age group (per 100,000 workers), annual average for 2021/22-2025/26.
Main kinds of fatal accidents for workers (2025/26)
The most common kind of fatal accident continues as falls from a height, accounting for over a quarter of fatal injuries to workers in 2025/26.
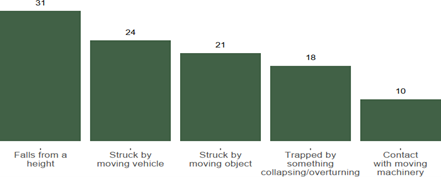
Note: Chart above shows all accident kinds accounting for 10 or more deaths in 2025/26.
104 members of the public were also killed in work-related accidents in 2025/26 (excludes deaths due to work-related accidents to ‘patients and service users’ in the healthcare and adult social care sectors in England reportable under RIDDOR).
Injuries by industry
There are two ways of looking at fatality numbers. The first is to look at the absolute count: construction and agriculture, forestry and fishing consistently account for the greatest number of fatalities each year.
The overall profile of fatal injuries to workers by industry sector in 2025/26 is broadly similar to the profile for the 5-year period 2021/22-2025/26 with construction and agriculture, forestry and fishing accounting for just under 40% of fatal injuries to workers in 2025/26.
- Despite a reduction in the number of deaths to construction workers in the latest year (25 deaths in 2025/26 compared to an annual average of 37 over the last 5 years), the construction sector continues to account for the largest share of fatal injuries to workers of all main industry sectors.
- In agriculture, forestry and fishing there were 22 fatal injuries in 2025/26, a decrease of 1 from the previous year total (23) and similar to the annual average number of deaths over the latest five-year period.
The second approach of looking at fatality numbers is to consider the fatal injury rate in terms of the number of fatalities per 100,000 workers employed: agriculture, forestry and fishing and waste and recycling typically have the highest rates.
Rate of fatal injuries by selected main industry group (per 100,000 workers), 2025/26 and annual average for 2021/22-2025/26.

Based on the annual average rates for 2021/22-2025/26 (as this reduces the effect of year-on-year fluctuations and gives a more stable picture):
- The rate of fatal injury to workers in the agriculture, forestry and fishing sector remains markedly higher than the average across all industries: 21 times as high as the all industry rate.
- The waste and recycling sector also has an elevated rate of fatal injury over this period compared to the average across all industries: 10 times as high.
- The rate of fatal injury in construction, while around 5 times as high as the average rate across all industries, is considerably less than the rate in agriculture, forestry and fishing despite accounting for a greater number of cases.
- The manufacturing, transportation and storage, and administration and support services sectors all have elevated rates compared to the average rate across all industries: around 1.5 to 2.5 times the average rate.
- While the combined ‘wholesale, retail, motor repair; accommodation and food services’ sector accounted for around 9% of fatal injuries between 2021/22 and 2025/26, in terms of rate the overall sector is relatively low risk with an injury rate of around half the average rate across all industries. However, there will be variation in risk across activities within the sector.
Injuries by accident kind
Below – The profile of fatal injuries to workers by accident kind in 2025/26 is broadly similar to the profile for the 5-year period 2021/22-2025/26, with around 80% of all fatal injuries accounted for by just 5 different accident kinds in 2025/26.
Falls from a height has been the main cause of work-related fatal injury in almost every year since at least 2001/02. Number of fatal injuries to workers by accident kind, 2025/26 and annual average for 2021/22-2025/26.
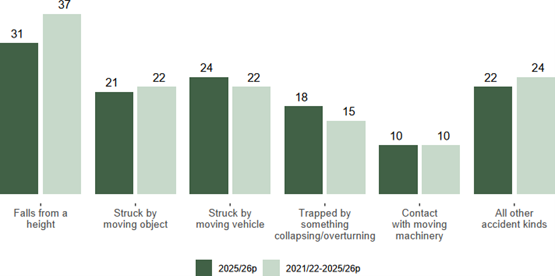
Based on the annual average number of deaths for 2021/22-2025/26 (as this reduces the effect of year-on-year fluctuations and gives a more stable picture):
- Around 60% of all fatal injuries were accounted for by just three accident kinds: falls from a height, struck by a moving object and struck by a moving vehicle.
- An average of 37 deaths per year were due to falls from a height, representing 28% of all worker fatal injuries over this period.
- Being struck by a moving object and being struck by a moving vehicle each accounted for an average of 22 deaths per year (17%).
By sector, there is variation in the profile of fatal injuries to workers by accident kind, to some extent reflecting the varying risks present across industries. For example:
- A markedly higher proportion of worker deaths in construction were due to falls from a height compared to other sectors, with over half of all deaths in construction over this five-year period accounted for by this accident kind (average of 19 deaths per year).
- While being struck by a moving vehicle accounted for around 17% of all deaths, this proportion was markedly higher in waste and recycling (48%), transportation and storage (30%) and agriculture, forestry and fishing (23%).
Injuries by employment status
Around a third of fatal injuries to workers in 2025/26 were to the self-employed, similar to the profile of worker deaths for the combined five-year period 2021/22-2025/26, even though such workers only made up around 15% of the workforce.
The higher proportion of fatal injuries among self-employed workers partly reflects their greater presence in higher-risk industries. As illustrated in below, the proportion of fatal injuries involving self-employed workers tends to be higher in those sectors where self-employment is especially common – particularly agriculture, forestry and fishing, and construction.
Percentage of fatal injuries below to self-employed workers for selected industries, 2021/22-2025/26.

However even within industry sectors, notable differences remain. Over the five-year period 2021/22-2025/26, the overall fatal injury rate for self-employed workers is around three times as high as the employee rate. While this gap varies by industry, the rate of fatal injury is generally higher for self-employed workers than employees across all the main industry sectors.
Rate of fatal injuries to employees and self-employed workers (per 100,000 employees/self-employed) for selected industries, 2021/22-2025/26.
Notes:
- Chart includes main industry sectors with more than 50 worker deaths over the latest five-year period.
- ‘Wholesale, retail, motor repair; accommodation and food services’ has been abbreviated to ‘Wholesale/retail/MVR/accom/food’ for the purposes of this chart.
Longer term trends
Despite long term reductions in the number of workers killed by work activities, each year such cases continue, with 126 such deaths in 2025/26. This number compares with 217 twenty years ago (2005/06) and 495 in 1981 (prior to 1981 only fatal injury numbers to employees were reported to enforcing authorities).
Number of fatal injuries to workers in Great Britain, 1981-2025/26.

Summary
The 126 worker deaths in 2025/26 represents a decrease of 2 from the previous year. Apart from the years affected by the coronavirus pandemic, the number of worker deaths in 2025/26 is the lowest number recorded in a single year.
When considering trends over time it is preferable to consider the rate of injury rather than just the number of injuries as the rate accounts for changes in the numbers in employment between years. Taking employment levels into account, the 126 fatalities in 2025/26 equates to a fatal injury rate of 0.37 deaths per 100,000 workers.
Over the long-term, the rate of fatal injury to workers showed a downward trend, though the rate of decline has slowed in recent years.
This represents a refinement of previous assessments that describe the rate in recent years as being broadly flat, reflecting updated modelling of underlying trends.
Speak with our Safety Experts